If you are a host, content platform, or some other type of B2B2C product, your users might want to know their traffic or usage metrics. To put it another way: if your users have their own users, sometimes your users want analytics about their users. Customer-facing analytics are analytics you capture and display to your users to fulfill this need.
This tutorial shows you how to set up customer-facing analytics using PostHog and its API, Next.js, and Tremor (a React visualization library). You need a PostHog instance (sign up for free) as well as a way to filter your analytics for an individual user, such as a user or group property (like name, domain, ID).
Thanks to Mintlify for the inspiration for this tutorial. Find out how and why Mintlify used PostHog and Tremor to launch user-facing analytics within their product!
Creating sample customer-facing insights
First, create insights to act as a reference for your customer-facing dashboard. This may include insights like:
- unique visitor count
- pageviews
- form submissions
- button clicks
These must all be filterable by a group or person property so you can show each user the insights relevant to them. As an example, we will create two insights, a pageview line graph and an "insights created" number. We filter them for the group named "PostHog" as an example of a filter.
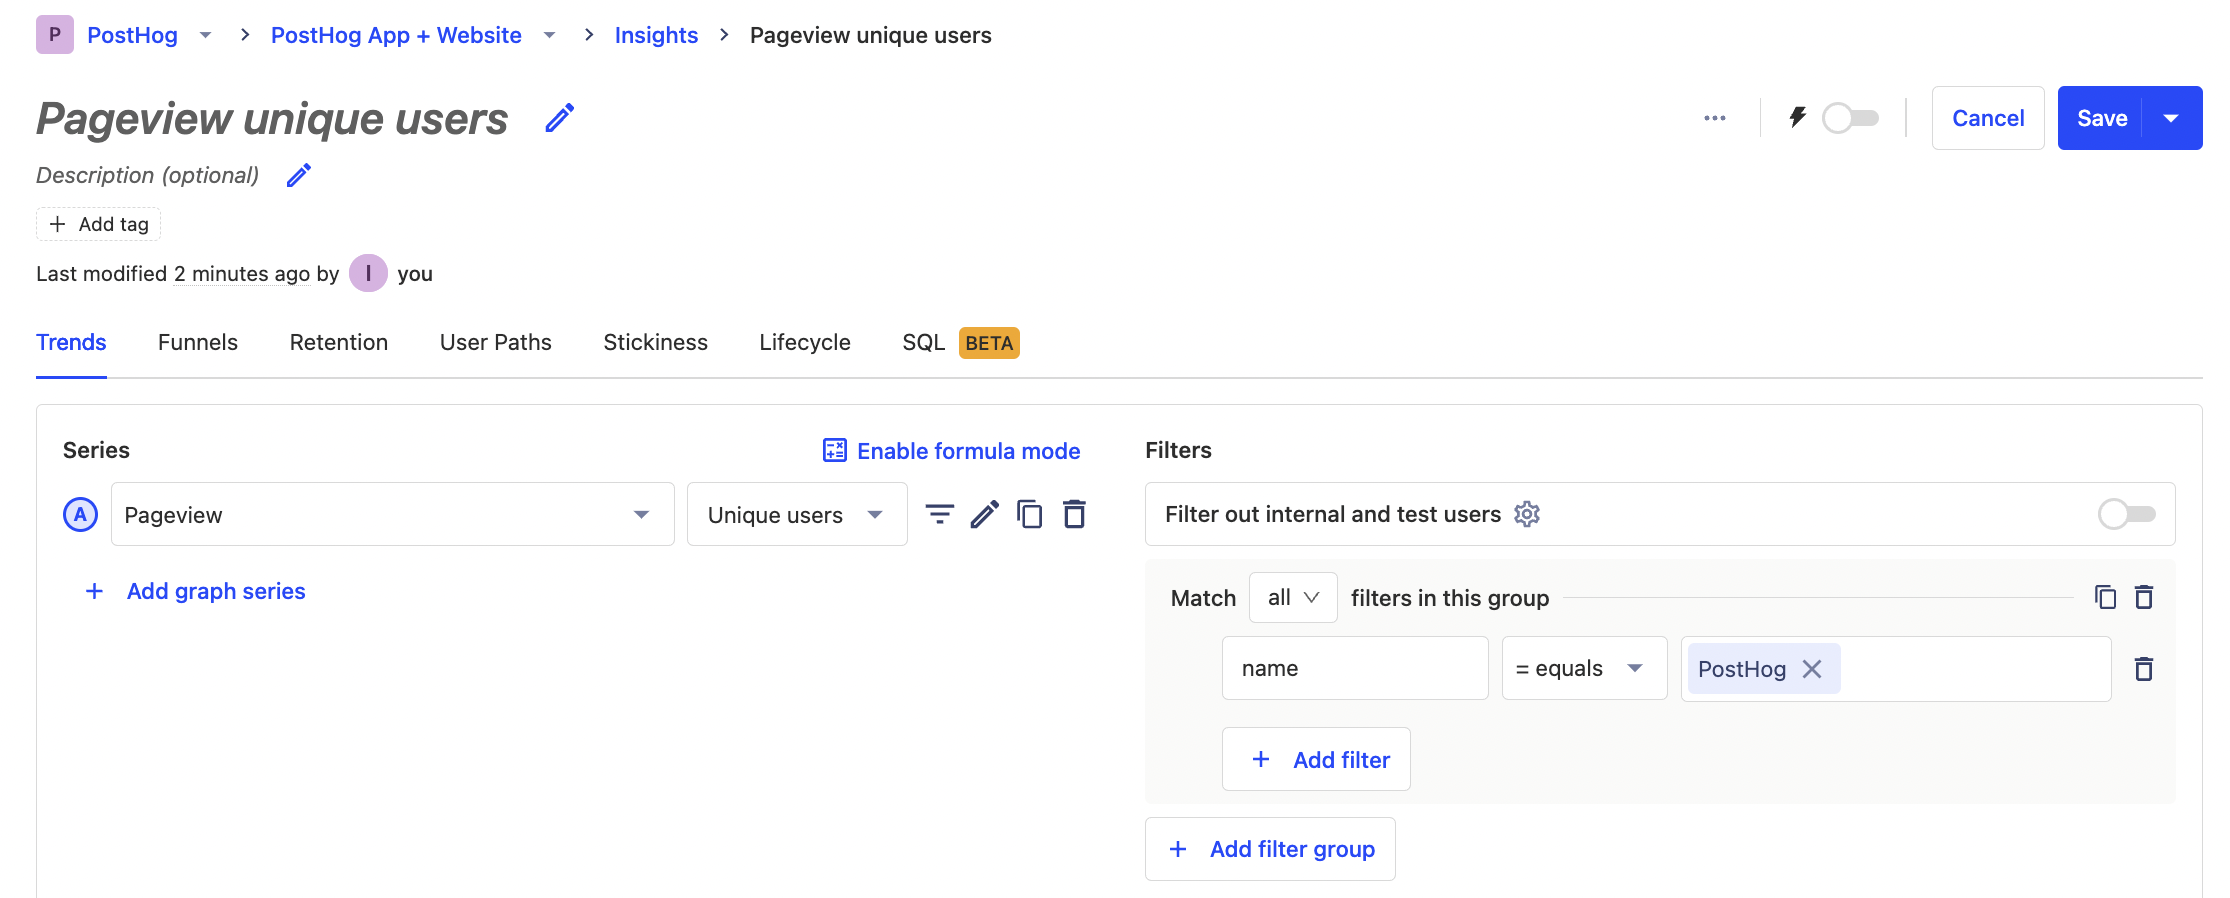
Note: if you are testing your sample insight filter with your own company (like for me and PostHog), make sure to uncheck "Filter out internal and test users."
Together on a dashboard, they look like this:
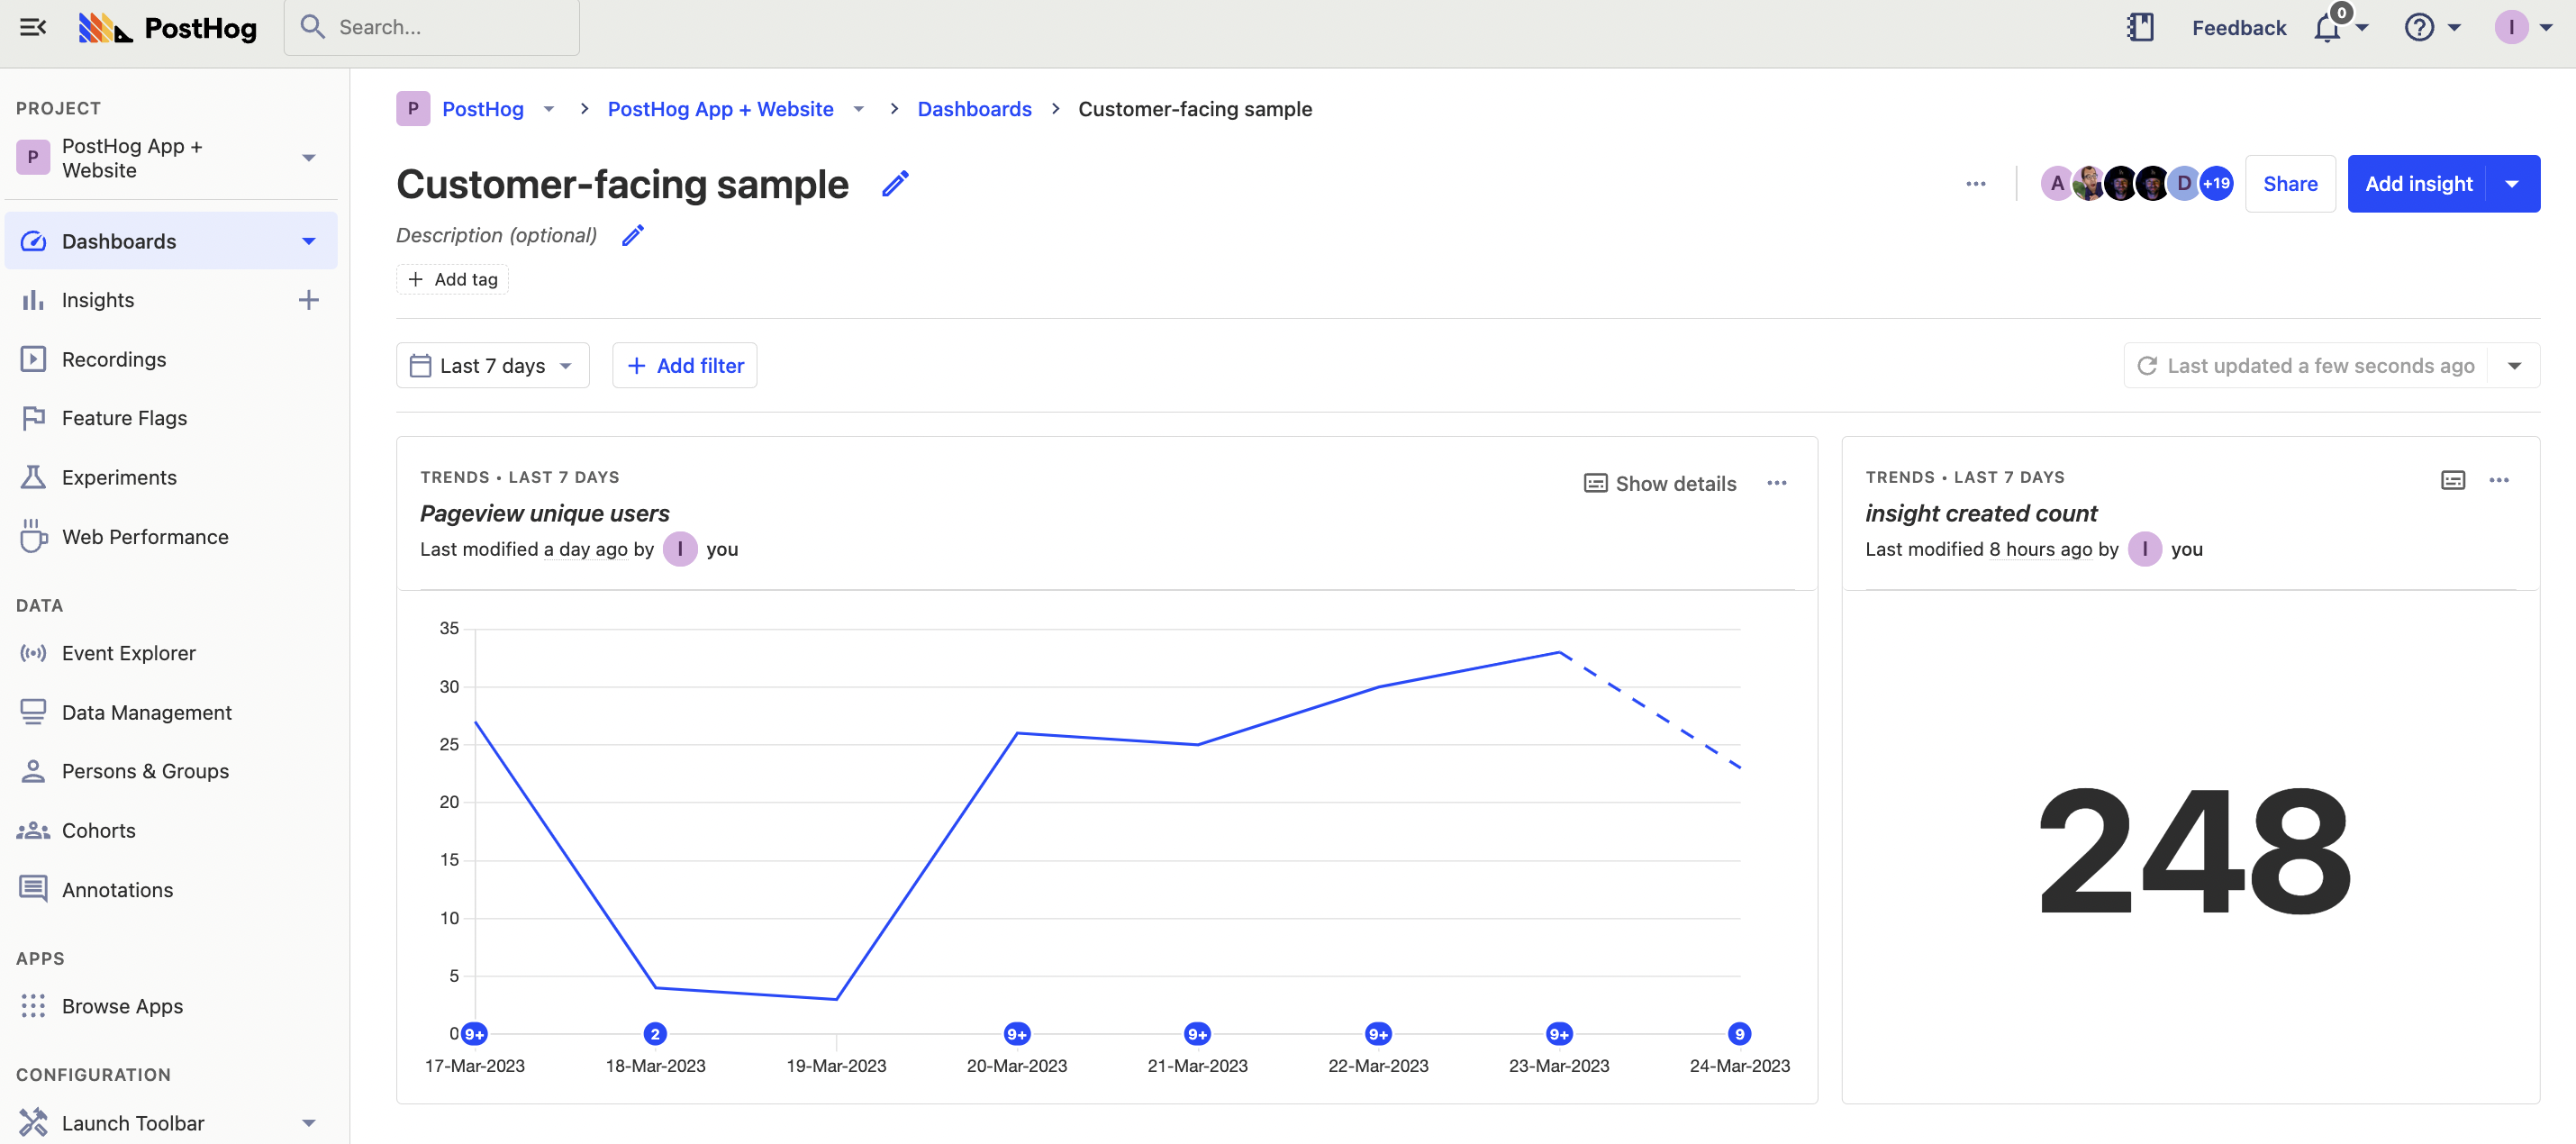
These sample insights help us figure out the params to make API requests to filter and get this data for all the different users.
Getting the params for our API request
Next, we need to set up the API requests to get the data from PostHog for our customer-facing insights. To do this, we will use the <ph_instance_address>/api/projects/<project_id>/insights/trend endpoint with events, display, and properties params, but we need to figure out these params first.
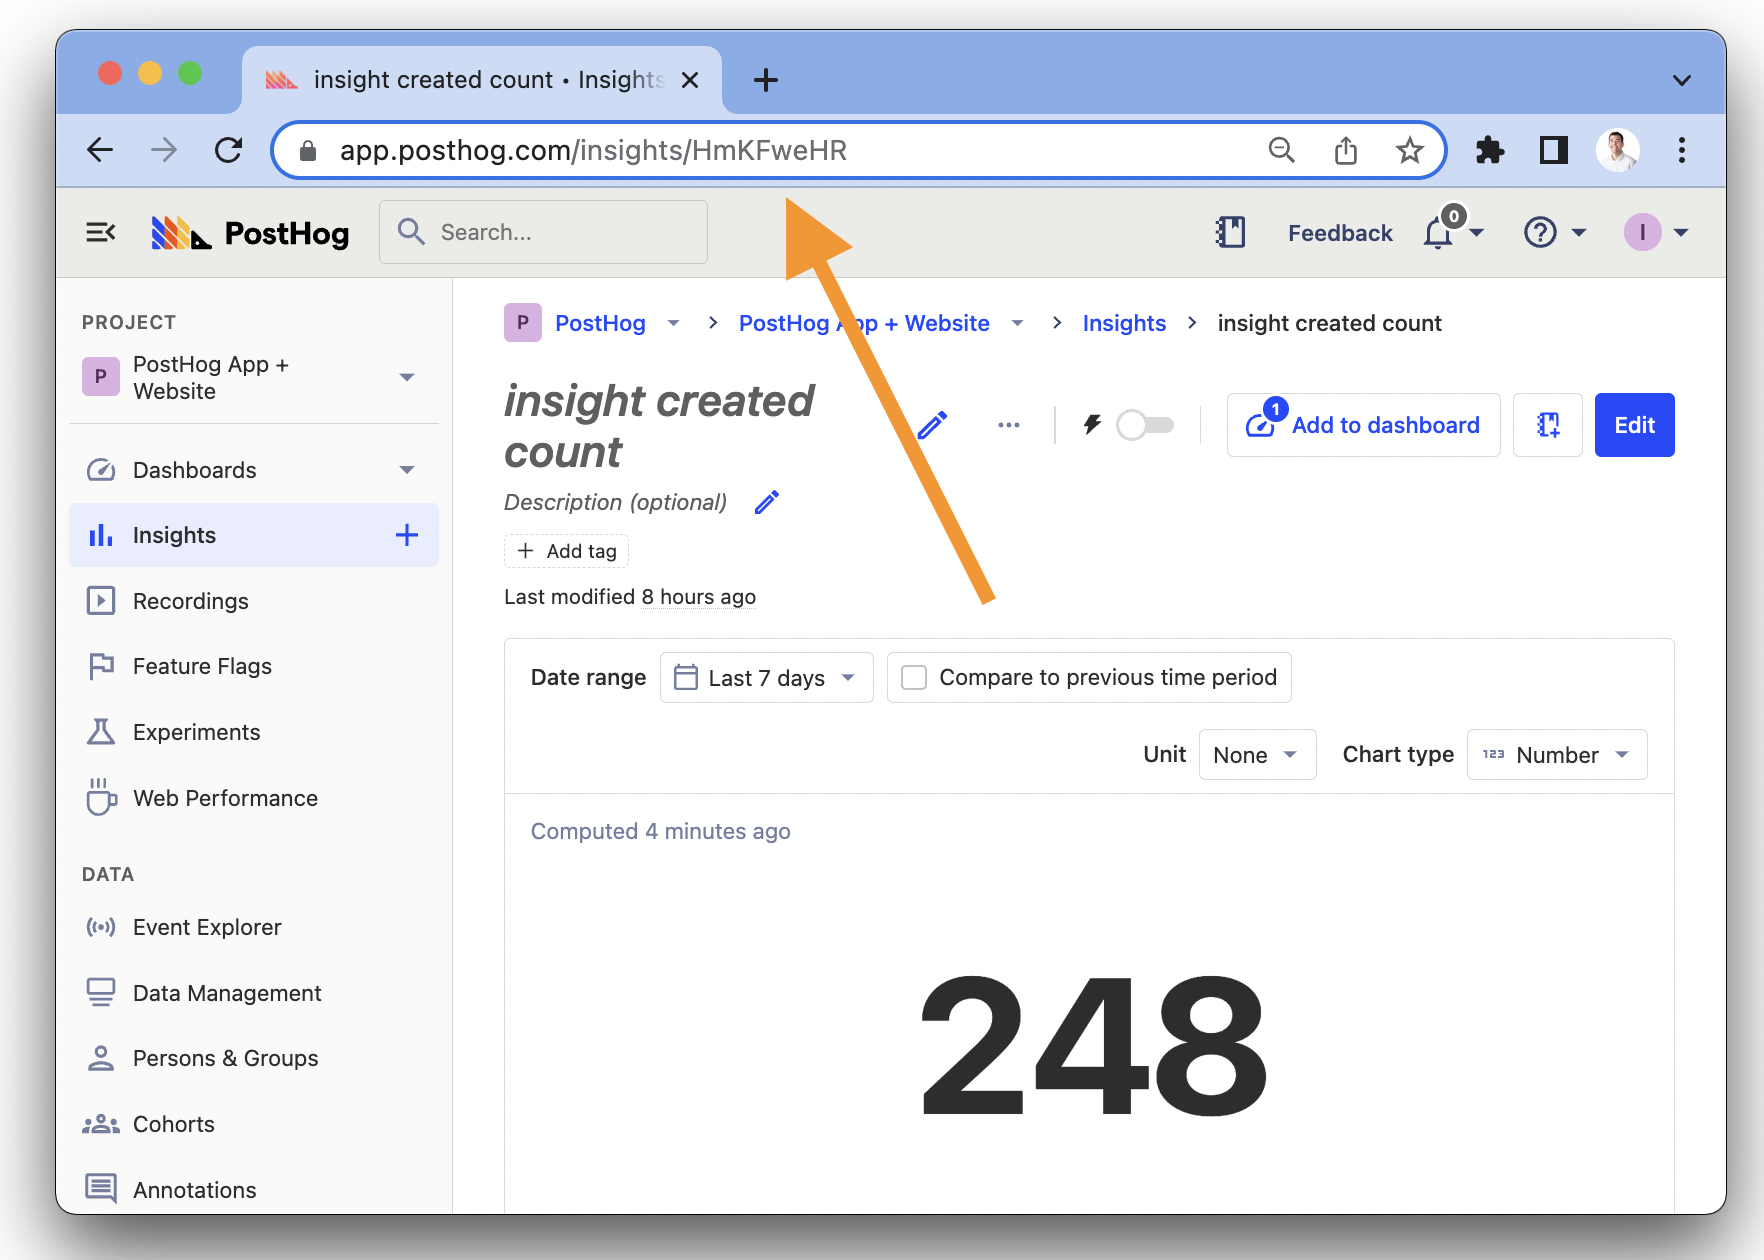
To quickly figure out the params for our request, we can make a different request to each of the insights individually. To do this, get the "short ID" from the URL of each of the insights. It is an eight character value like HmKFweHR:
To make the API request to get the data about this insight, you need the insight short ID, your project ID (found in project settings), and a personal API key. To create a personal API key:
- Click the icon in the top right corner of your PostHog instance.
- Click the gear next to your name and email.
- On the "My settings" page, scroll down to "Personal API Keys."
- Click the "Create personal API key" button.
- Add a name and click "Create key."
- Copy your personal API key.
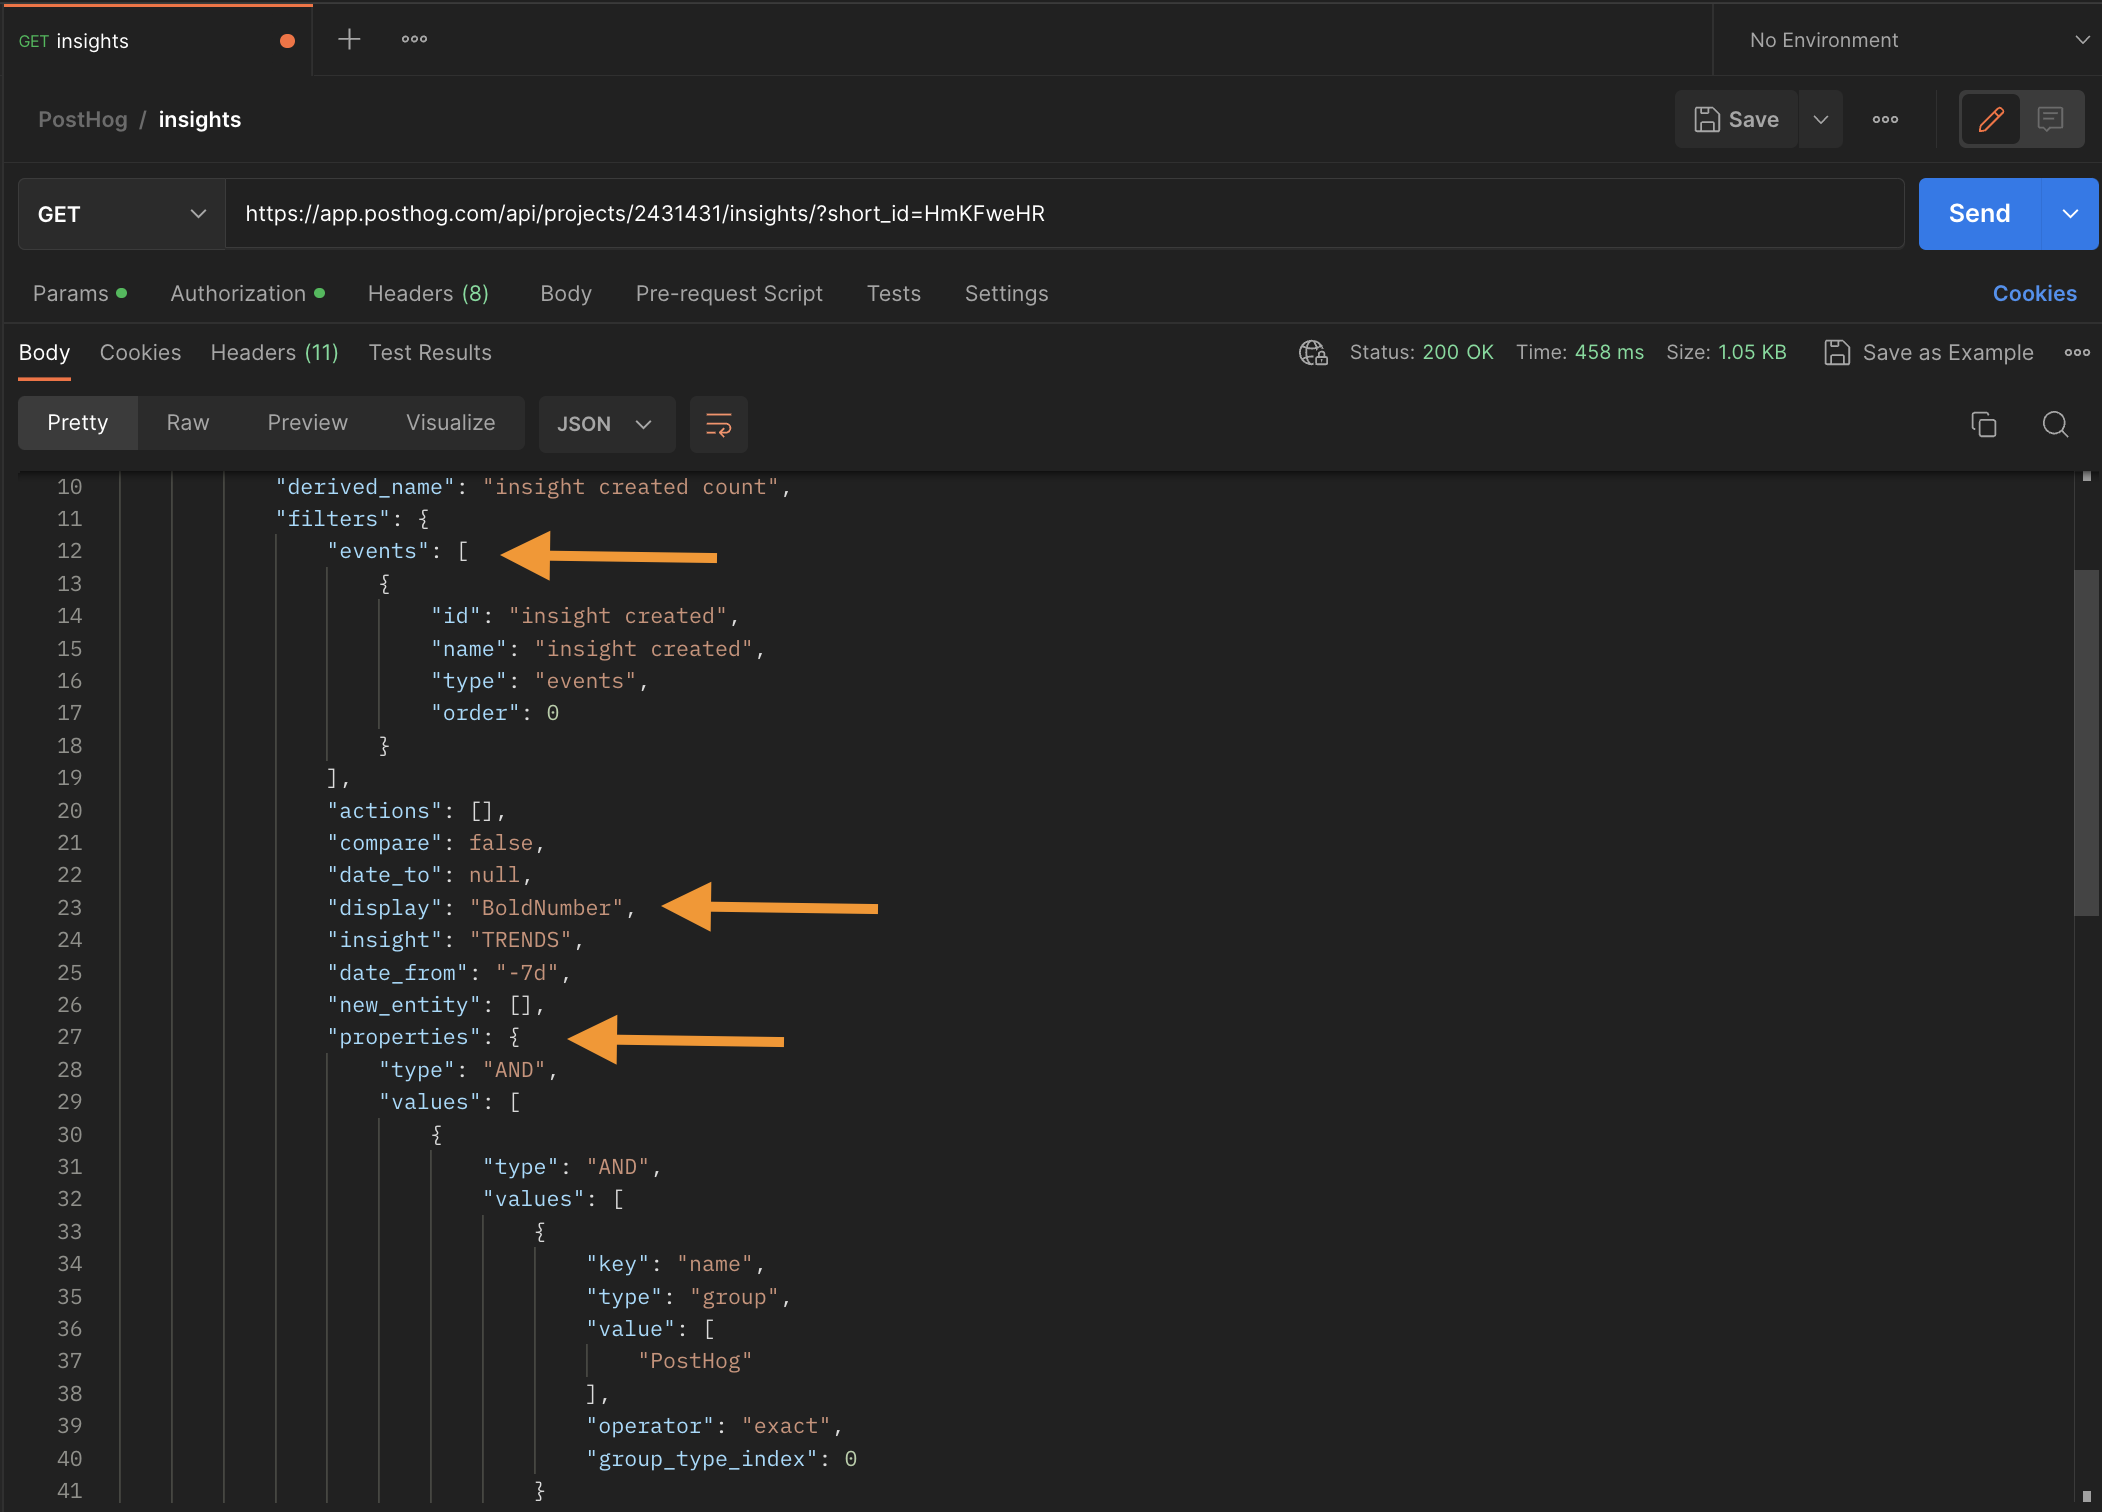
With your personal API key, project ID, and insight short ID, you can make a request to the <ph_instance_address>/api/projects/<project_id>/insights endpoint (different from the one we’ll use later) to get all the data about that insight like this:
The objects and arrays we want are under results → filters → events, properties, display. Copy them to use them in the next step.
Creating our customer-facing analytics Next.js app
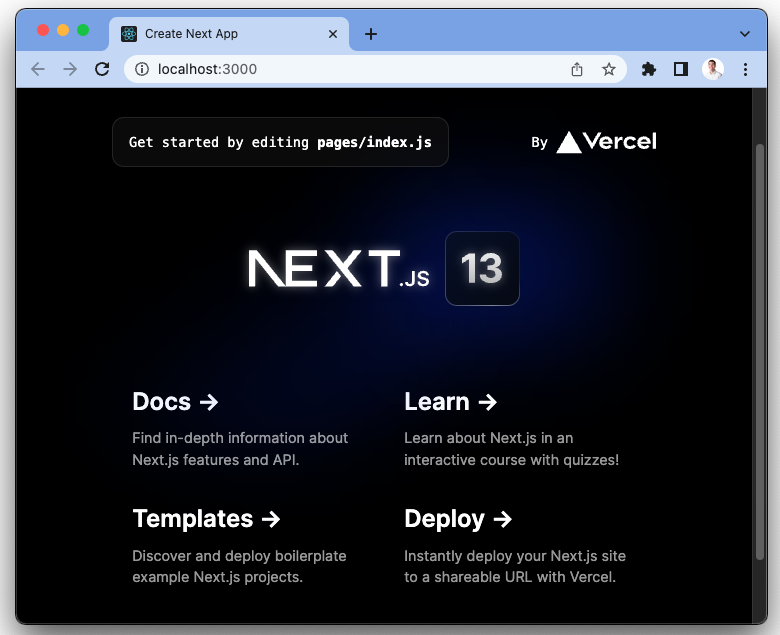
You will likely build customer-facing analytics into your app, but for this tutorial, we'll build ours as a Next.js app. The first step is to create a basic Next.js app:
Choose not to use TypeScript, not to use the app router, and the defaults for the rest. Once done creating, go into our newly created analytics folder and run our app.
This creates a basic Next app for our customer-facing analytics.
Getting the data into our app using the PostHog API
In our Next.js app, create a .env.local in the base analytics directory and add the personal API key we created earlier.
In the pages folder, create a new file named insights.js and add a getServerSideProps function at the bottom of the file that:
- gets group or user property to filter from the URL (context)
- sets our
events,display, andpropertiesparams - formats the
fetchGETrequest to<ph_instance_address>/api/projects/<project_id>/insights/trend?${params} - passes the response data as a prop to our component
For our "insights created" insight, this looks like this:
When we go to http://localhost:3000/insights?filter=PostHog, we filter for values from the group named "PostHog." You can vary this ?filter= value to provide different analytics for different users.
Displaying our customer-facing data using Tremor
With our customer-facing data in our app, we can visualize it. To do this, we use Tremor, a React visualization library using Tailwind.
Setting up Tremor
We follow their installation guide here. First, install Tremor:
Next, install Tailwind CSS and its dependencies, then initialization Tailwind CSS:
Add the paths to your template files in your tailwind.config.js file:
Finally, add the @tailwind directives for each Tailwind's layers to your globals.css file:
Using Tremor to display the data
With our data and Tremor set up, we can use a Tremor component to display the data from PostHog.
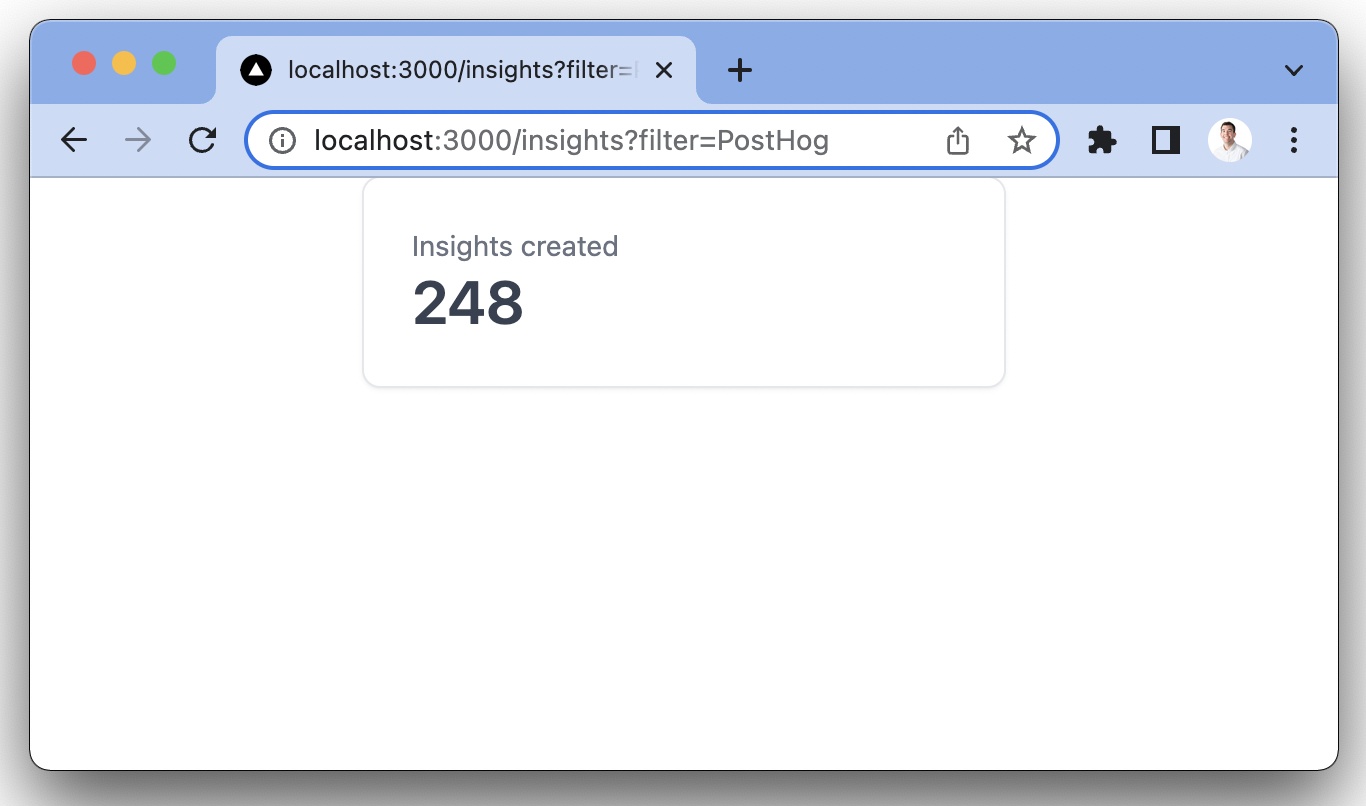
Import the Card, Text, and Metric components from Tremor. Also, set up the component to receive the count prop we are passing from getServerSideProps, and use it in the Metric component. Combining these two looks like this:
This gives us a nice-looking start to our customer-facing dashboard.
Next is setting up and displaying a trend.
Getting trend data
To display a trend, we go through the whole insight creation process again:
- Get params for the API request from
insightendpoint with short ID (oureventsanddisplayparams are different, but ourpropertiesfilter is the same). - Set up the API request in
getServerSideProps. - Display that data using Tremor.
The difference with the trend data is that:
- It uses a different
eventsparam to get unique user$pageview. We add themath: 'dau'key to get unique users. - The data from PostHog requires formatting, we do this with a
.map()call of the data. - The visualization is a more complicated Tremor
LineChartto display our data.
Once you’ve implemented this, here’s what gets added or changed in the getServerSideProps() function:
You’ll see we do a simple map() of the data points we get from PostHog. This is to format them for use with Tremor, which is up next.
Displaying trend data with a Tremor line graph
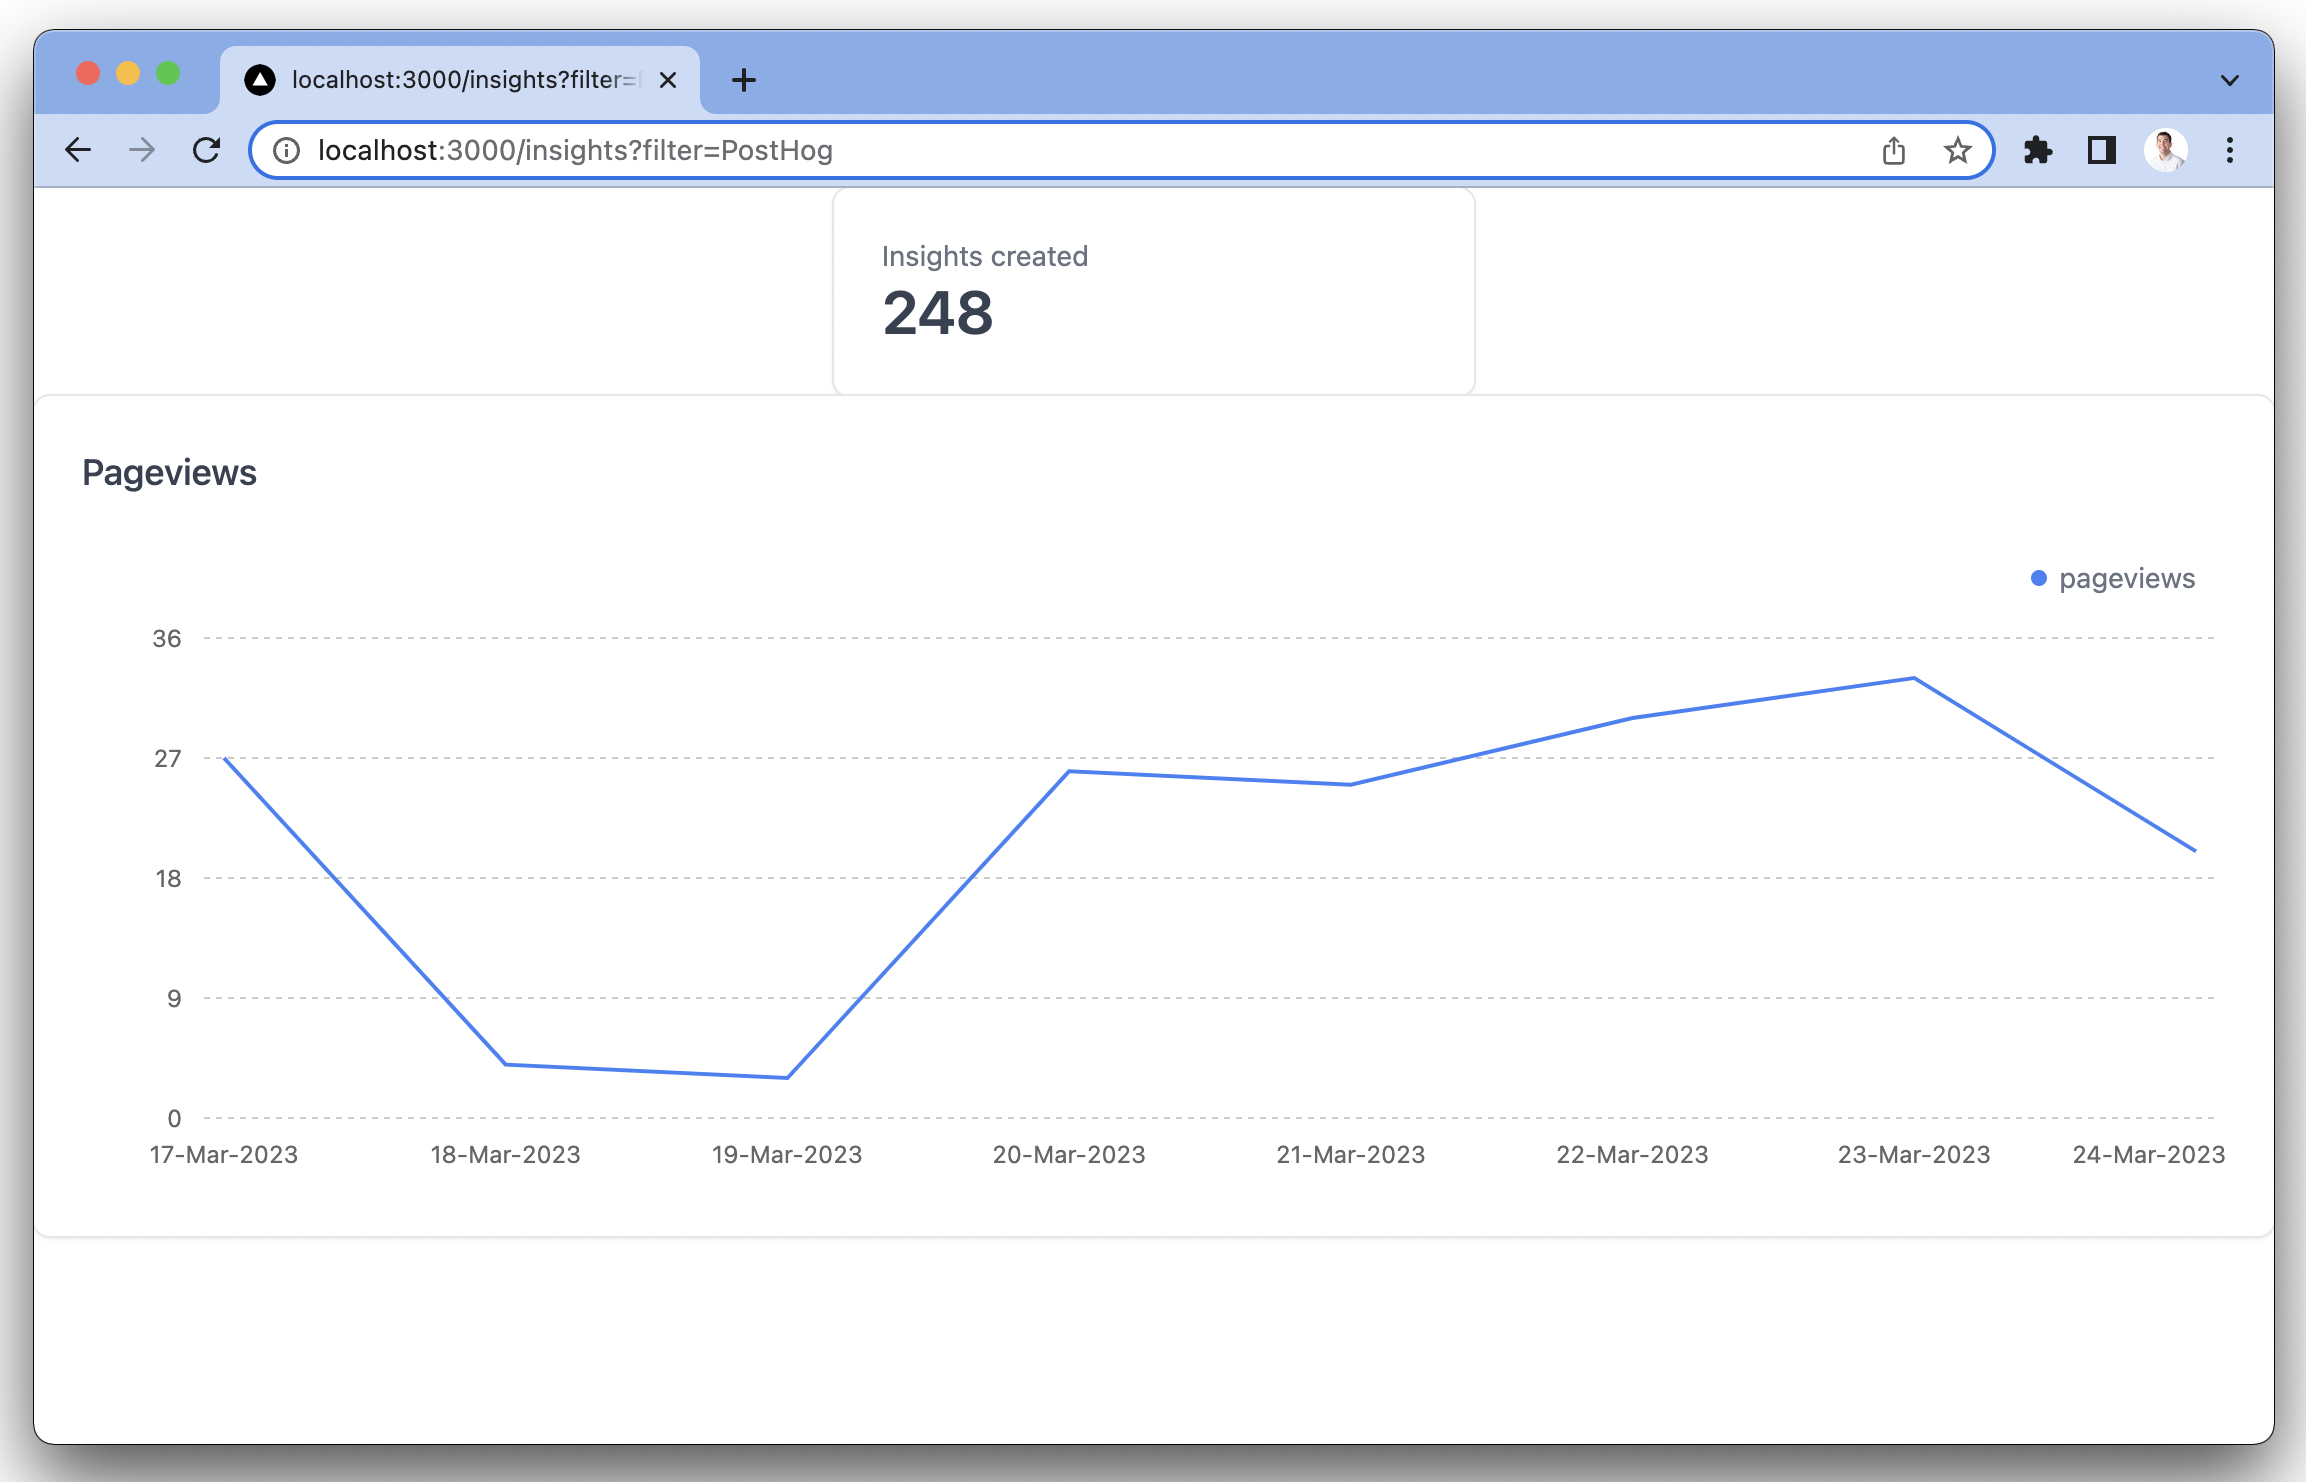
To display a line graph, import Title and LineChart from Tremor, handle our chartData prop, and configure the LineChart component.
This gives us a line chart of the pageviews from unique users from PostHog over the week.
From here, you can add other charts and metrics. See the PostHog API for what data you can get from PostHog, and Tremor for the ways you can display it.
Want to know more? Find out how and why Mintlify used PostHog and Tremor to launch user-facing analytics within their product!

